Interface Overview
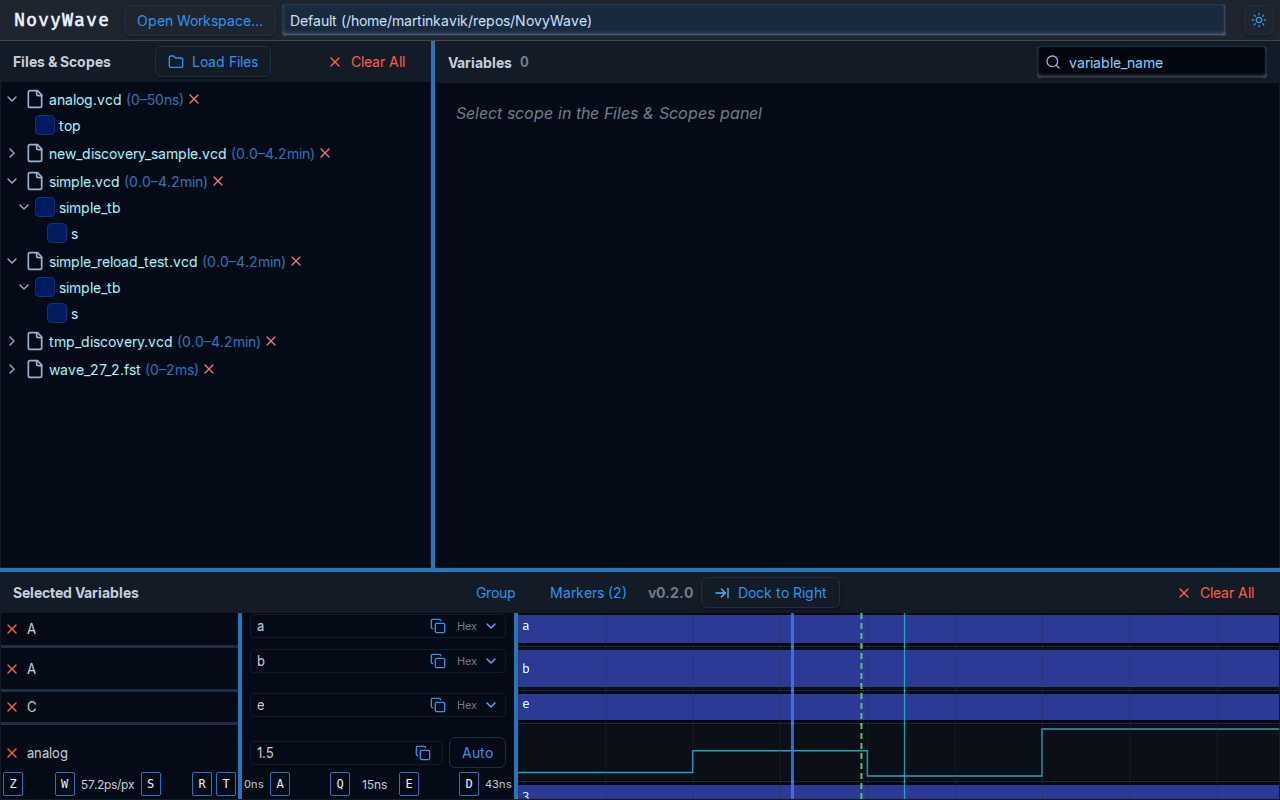
NovyWave’s interface is built around a three-panel workflow that mirrors how you naturally work with waveforms: find the right files, pick the signals that matter, then explore them on a shared timeline.
Main Panels
Section titled “Main Panels”Files and Scopes
Section titled “Files and Scopes”Use this panel to:
- open waveform files,
- expand scope hierarchies,
- switch the active scope,
- remove files from the current workspace.
Variables
Section titled “Variables”This panel lists signals from the currently selected scope.
- search filters the list in real time,
- each row shows the variable name and type,
- clicking a variable adds it to the waveform view.
Selected Variables
Section titled “Selected Variables”This panel combines the value list and the waveform timeline.
- the left side shows selected signals and per-signal format controls,
- the timeline shows transitions over time,
- the footer exposes time range and zoom information.
Two Important Guide Lines
Section titled “Two Important Guide Lines”Green Dashed Line: Zoom Center
Section titled “Green Dashed Line: Zoom Center”The green dashed line controls where zooming happens. When the mouse is over the waveform area, zoom operations happen around that position.
Blue Line: Cursor
Section titled “Blue Line: Cursor”The blue line controls value inspection. The value column updates for the current cursor time.
Marker Lines
Section titled “Marker Lines”Named markers appear as additional vertical lines on the timeline. Each marker has a label and a fixed time position. Use them to bookmark events or transitions you want to revisit.
Typical Workflow
Section titled “Typical Workflow”- Load one or more waveform files.
- Expand the scope tree and choose a scope.
- Add interesting signals from the Variables panel.
- Use
W,S,A,D,Q, andEto navigate. - Change individual value formats or copy a formatted value when needed.
Dock Modes and Theme
Section titled “Dock Modes and Theme”Global controls let you:
- switch between dark and light themes,
- move the selected-variable area between bottom and right dock modes,
- preserve those choices between sessions.
Signal Groups
Section titled “Signal Groups”You can organize selected signals into named groups. Groups appear as collapsible sections in the Selected Variables panel, making it easier to manage large sets of signals. Each group has a name and can be expanded or collapsed independently.
Named Markers
Section titled “Named Markers”Markers are labeled bookmarks on the timeline. Press M to create a marker at the current cursor position — NovyWave will prompt you for a name. Press 1 through 9 to jump directly to a marker. Markers are saved in the configuration file and persist across sessions.
Per-Signal Row Height
Section titled “Per-Signal Row Height”Each signal row in the timeline can have its own height. Drag the divider between rows to resize. The default height is 30 pixels for digital signals. Analog signals use taller rows to show waveform detail.
Analog Signals
Section titled “Analog Signals”Real-valued signals (such as voltages or currents from analog simulations) render as continuous waveform traces instead of digital blocks. NovyWave auto-scales the vertical range to fit the visible data, or you can set manual min/max limits.
Waveform Tooltips
Section titled “Waveform Tooltips”Hover over the timeline area to see signal values at the mouse position. Press T to toggle tooltip visibility.
Workspace Picker
Section titled “Workspace Picker”NovyWave remembers your recent workspaces. The workspace picker lets you switch between project directories, and each workspace maintains its own configuration file.